









Career
Data Ops Analyst: Role, Skills, and Career Path
Learn what a data ops analyst does, the skills and tools required, sample interview questions, and how to build a career in this growing operations role.
Interview Pilot Editorial Team
Updated October 19, 2026
16 min read

Your Monday starts with a dashboard alert: revenue is down sharply, and the report your leadership team checks first is suddenly telling a worrying story. Before anyone decides sales have collapsed, someone needs to establish whether the business changed or the data did. That's the work of a data ops analyst: keeping data dependable enough that people can act on it with confidence.
The role isn't about writing queries or building charts. It sits where data pipelines, quality checks, definitions, and business decisions meet. To understand the job, follow what the analyst owns when the numbers stop making sense.
What a Data Ops Analyst Actually Does
A revenue dashboard drops 30% on Monday morning. The first move isn't to change the chart or reassure the sales team. It's to find out whether the number reflects real business activity.
A data ops analyst checks whether the relevant data arrived on schedule, whether the upstream source changed, and whether the transformation that feeds the dashboard ran as expected. They check permissions and filters, too: sometimes the data is intact, but a change in access or reporting logic makes part of it disappear. Only after tracing the issue can the analyst say whether the decline is real, a measurement problem, or still uncertain.
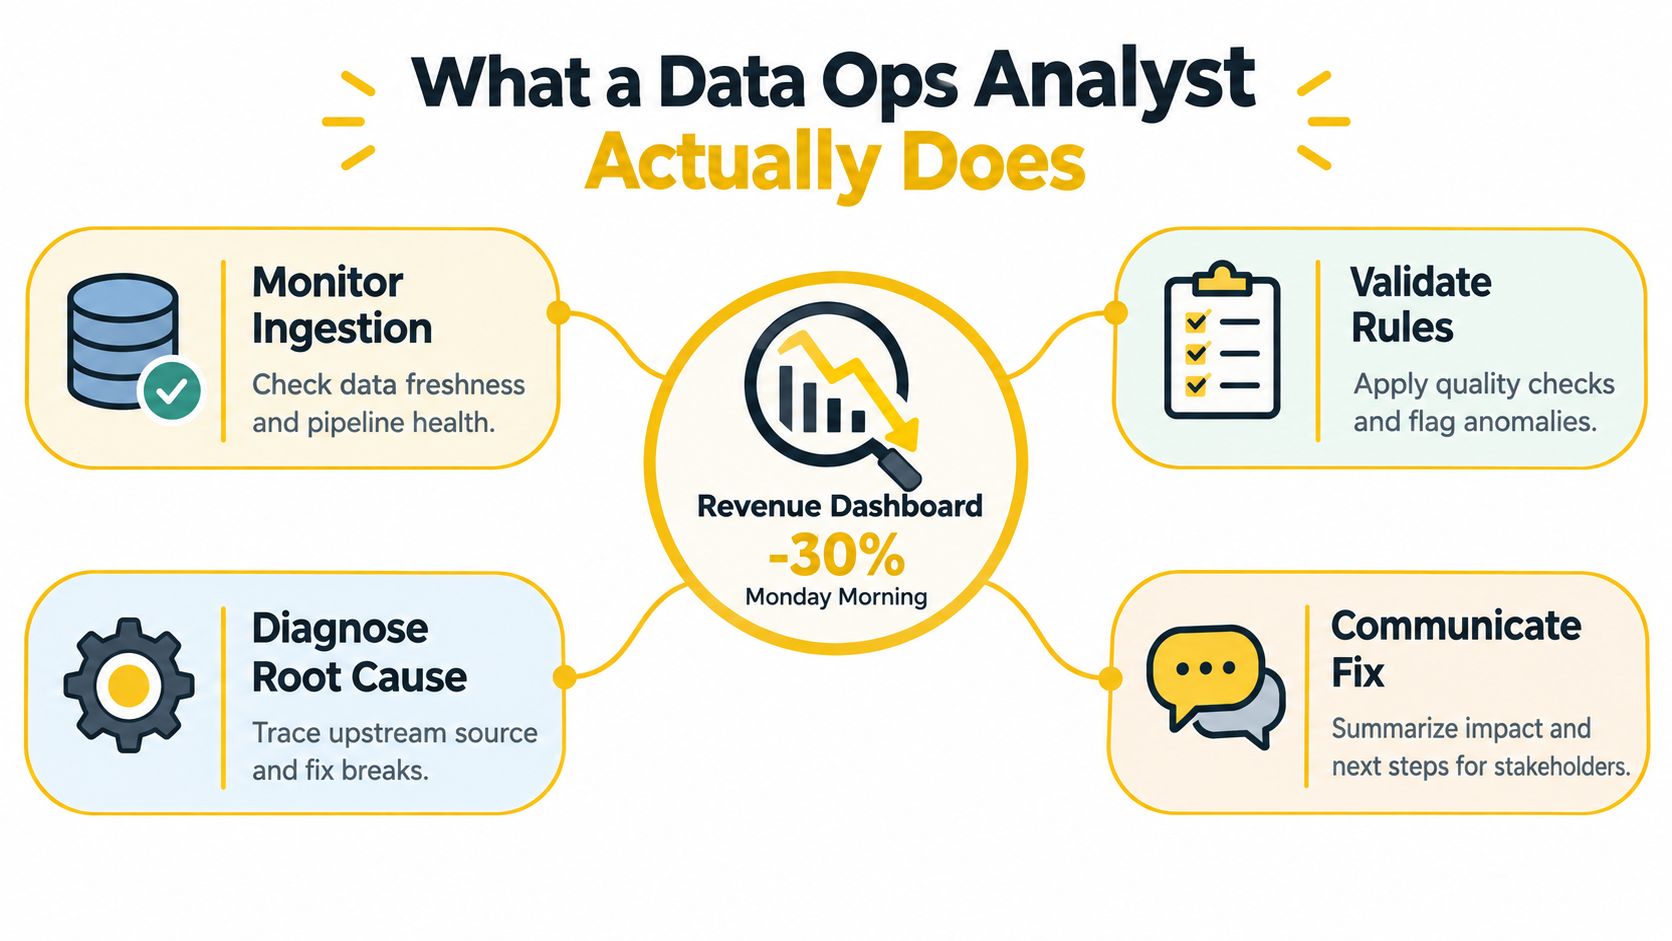
Own the reliability, not just the report
A data ops analyst helps keep data usable across its journey from source system to business decision. That means monitoring pipeline freshness, checking agreed metric definitions, preserving lineage, managing or coordinating access, investigating anomalies, and communicating incidents clearly.
A junior data analyst might be asked to explain what happened to revenue after the data is ready. A data ops analyst is also expected to ask whether the data is ready to interpret at all. The distinction isn't absolute: teams divide these responsibilities differently, and titles often overlap. What matters is the ownership boundary. The analyst doesn't just spot that a number looks wrong; they help establish where the failure happened, who needs to act, and how to prevent the same silent defect from misleading people again.
This work also differs from analytics engineering and data quality roles, though it may overlap with both. Analytics engineers often focus on building and maintaining data models and transformations. Data quality specialists may concentrate on standards, testing, and governance. A data ops analyst connects operational signals to business impact, helping teams detect, investigate, and communicate failures across those boundaries.
The closest standardized U.S. labor-market benchmark is the Bureau of Labor Statistics category operations research analysts. In 2021, it employed approximately 104,200 people, with a median annual wage of $85,720. The BLS projected 23% growth from 2021 through 2031, compared with 5% for all occupations, implying roughly 24,000 additional positions. The category lists a bachelor's degree as typical entry-level education, while generally requiring neither prior related work experience nor formal on-the-job training (BLS data on occupations). It's a useful benchmark, not a direct count of data ops analysts, because the job title varies across employers.
Where the Role Came From
A data ops analyst's everyday checks have roots in a long shift in how organizations store and use information. The key idea is that operational reliability depends on understanding not only what a number means, but also how the underlying records relate to one another.
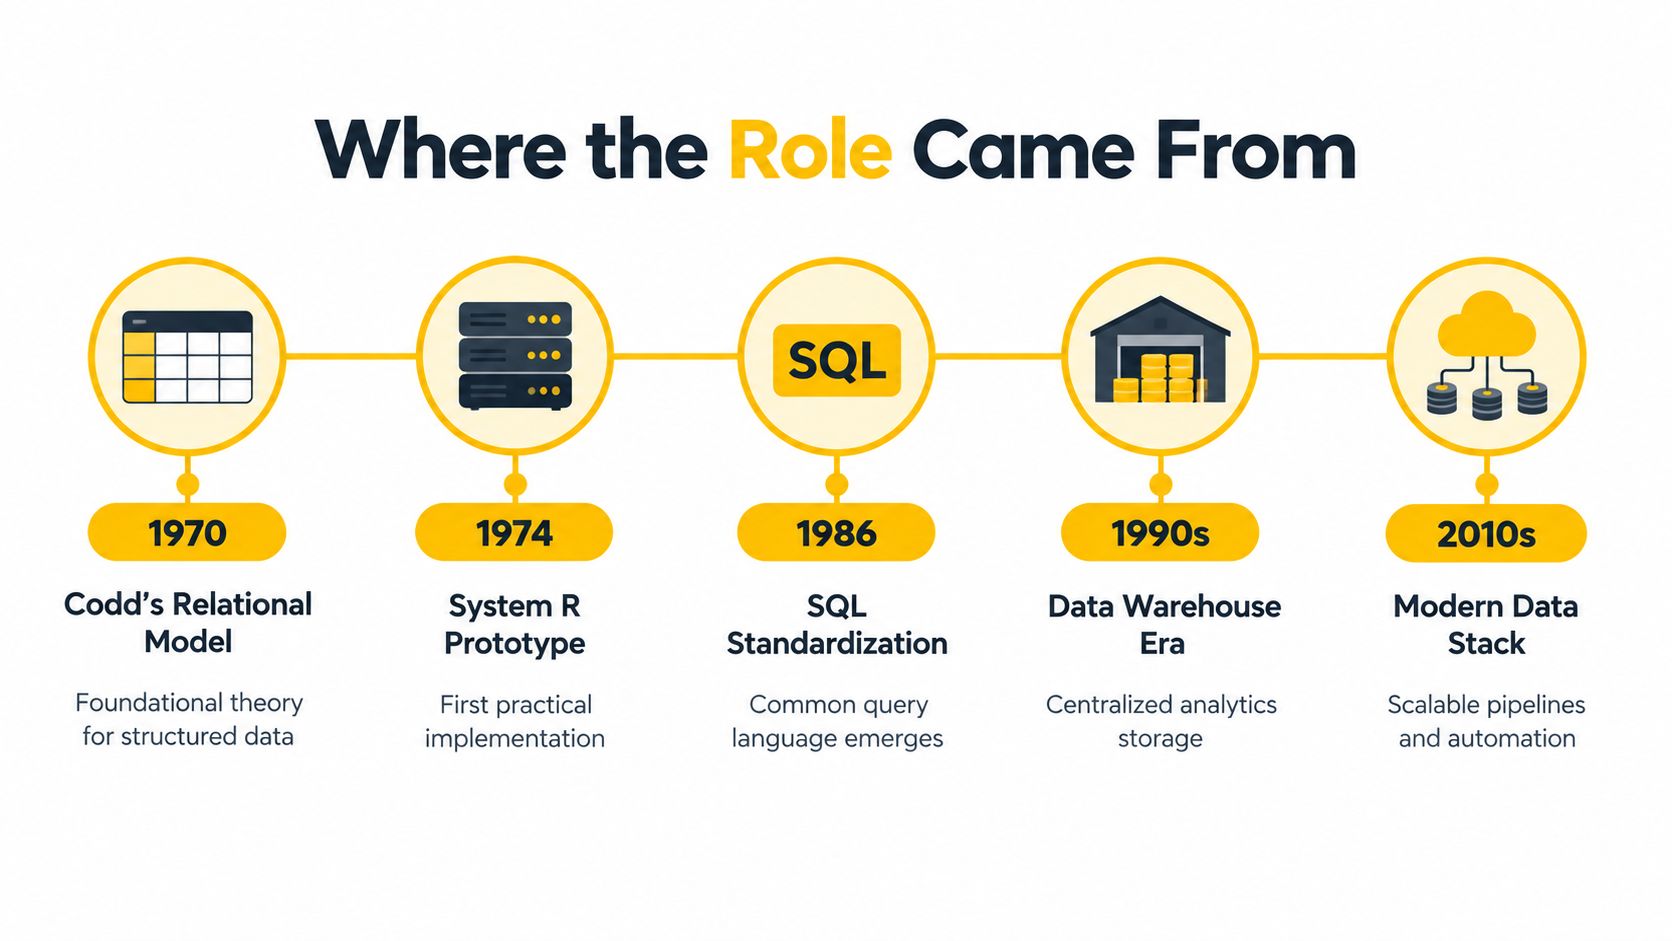
In 1970, IBM researcher Edgar F. Codd introduced the relational data model. It organized information into tables connected by defined relationships, making structured business data more practical to query than systems based only on sequential files or rigid hierarchies. That model gave analysts a durable way to reason about records: which entities they describe, how tables connect, and what a valid join should produce.
IBM began developing its System R prototype in 1974, and SQL emerged from that work. Oracle commercialized a relational database product in 1979, while SQL became an industrial standard in the early 1980s. Those milestones matter to today's data ops analyst because checks for duplicates, missing relationships, and inflated joins still depend on relational thinking. If an order table joins to multiple customer records unexpectedly, for example, a revenue total can grow even though no new sales occurred.
From structured tables to distributed systems
The data warehouse era of the 1990s made centralized analytics storage more common. It also sharpened the need to document what each table represented and how business measures were calculated. When teams later adopted web-scale and NoSQL systems in the 2000s, then massively parallel and distributed database platforms in the 2010s, they gained new ways to store and process data. They also had more pipelines, connections, and failure points to keep track of.
This history isn't a reason to memorize a technology timeline for its own sake. It explains why modern operational work involves both business logic and infrastructure: a trustworthy report depends on how records are modeled, stored, transformed, accessed, and governed. The same structured reasoning that helps an analyst trace a broken join also supports incident workflows used in other operations disciplines, such as DevOps interview preparation.
Core Responsibilities Across the Data Lifecycle
The role becomes easier to picture when you follow one data asset from ingestion to a decision. At each point, someone must make a judgment about whether the data is healthy, how problems should be handled, and who needs to know.

Five ownership zones
Ingestion monitoring starts with a simple question: did the expected data arrive? The analyst can monitor an ingestion timestamp, flag a feed that hasn't refreshed, and check whether a pipeline completed. A freshness check needs a clear expectation and an owner who can act when the feed goes stale.
Validation and quality rules turn assumptions into tests. A uniqueness check on an order identifier can catch duplicate records. A non-null test on a required field can prevent incomplete rows from flowing into a report. Accepted-value checks help catch unexpected category labels before they split or distort a metric.
Definitions and lineage protect shared meaning. If two dashboards calculate revenue differently, the analyst helps trace which tables and transformations each one uses and surfaces the definition stakeholders should rely on. Good lineage makes it possible to work backward from a dashboard to its source rather than guessing which step introduced a discrepancy.
Anomaly investigation means separating a business change from a data defect. The analyst might compare current source totals with warehouse totals, inspect recent transformation changes, and check whether access or filters changed. A ticket should record the observed issue, affected output, evidence gathered, and next action.
Access, escalation, and learning keep the response proportionate. A missing daily feed that blocks a leadership report may need immediate escalation; a minor formatting drift may be logged for follow-up. After an incident, the analyst documents the cause, correction, and prevention work so the team doesn't rely on memory next time.
Practical rule: A useful incident record names the validation rule, when the team detected the failure, who owns the fix, when to escalate, and how to correct or roll back affected outputs.
These decisions often involve engineers, analysts, business systems teams, and report owners. Clear handoffs matter as much as the technical check. For readers exploring the engineering side of that collaboration, data engineer interview guidance can help clarify how pipeline-building responsibilities connect to operational oversight.
Tools and Skills That Actually Move the Needle
For operational analytics, SQL is the primary control surface. It lets an analyst inspect records, join related tables, aggregate data at a defined level, and compare source and reporting totals. A job-market analysis found SQL in 52.9% of data-analyst postings, compared with 31.2% for Python; ETL appeared in 9.2%, while relational databases and data governance each appeared in 8.2% (data analyst job-market analysis).
Knowing SQL syntax isn't enough. Before writing a query, define the grain, or what one row represents. Is it one row per order, customer-day, or transaction? If you join two tables without checking their keys, the result can multiply records and inflate a total. Strong query work uses clear joins, staged transformations, documented assumptions, and checks for nulls, duplicates, date boundaries, and reconciliation against a source system.
Match the tool to the failure
| Tool | Best For | Lifecycle Stage | Failure It Helps Prevent |
|---|---|---|---|
| SQL | Inspecting, joining, filtering, and aggregating relational records | Validation and transformation | Duplicate joins, incorrect grain, and inconsistent totals |
| Python | Repetitive checks, larger datasets, anomaly detection, and recurring reports | Automation and monitoring | Manual copy-and-paste errors and missed repeat patterns |
| ETL platforms | Scheduling and coordinating data movement and transformation | Ingestion and delivery | Missed runs and untracked workflow dependencies |
| Warehouses | Centralized storage and querying of structured analytical data | Storage and analysis | Scattered reporting logic and inconsistent access to curated data |
Python earns its place when a check needs to run repeatedly, when spreadsheets become unreliable, or when the analyst needs to automate schema checks and quality summaries. A visualization tool is useful for spotting patterns, but a chart alone can't prove that the underlying records are complete or joined correctly.
Tools also have limits. SQL can surface a bad value, but the analyst still has to decide whether it represents a real business event or an upstream defect. A useful applied perspective is logistics data analytics insights, where data analysis connects operational information to decisions. Whichever stack you use, the core standard stays the same: another person should be able to reproduce the result and understand the assumptions behind it.
A Day in the Life of a Data Ops Analyst
At the start of a Tuesday, an overnight alert says a dashboard number has fallen sharply. The analyst doesn't begin by editing the dashboard. They check the run status and freshness of the source feed, then compare a source total with the number that reached the warehouse.
From first signal to confirmed cause
Once the initial checks show a mismatch, the analyst gathers the relevant people. An engineer can confirm whether the pipeline or source schema changed; the report owner can explain how the dashboard filters and definitions are supposed to work. The analyst keeps the conversation focused on evidence and impact, rather than letting the team jump to a conclusion before tracing the data.
A SQL reconciliation helps narrow down where the numbers diverged. If the source has the expected records but the warehouse does not, the analyst follows the transformation path and checks which step changed the output. If the records are present but a dashboard looks different, the investigation shifts toward filters, metric logic, or permissions.
The useful update isn't “we're looking into it.” It's what's affected, what's been checked, what remains uncertain, and when stakeholders will hear more.
After the cause is clear, the analyst explains the impact and next steps to the report's users. The wording should distinguish confirmed facts from working theories. If a report can't be trusted while the team fixes the issue, say so plainly rather than allowing people to make decisions from a known-bad number.
Close the loop before moving on
The afternoon may be less dramatic: confirm the correction, document the investigation, review lineage notes, or follow up on an access request. These tasks can feel routine, but they help the next person trace the same data without starting from scratch. A good closeout records what failed, how the team verified the fix, and what monitoring or rule should change.
When an interviewer asks how you prioritize, describe that rhythm. First establish impact and scope, then isolate the failure, communicate uncertainty, and leave the system easier to diagnose next time. That answer shows you understand the job beyond its tools.
Interview Questions and What Strong Answers Look Like
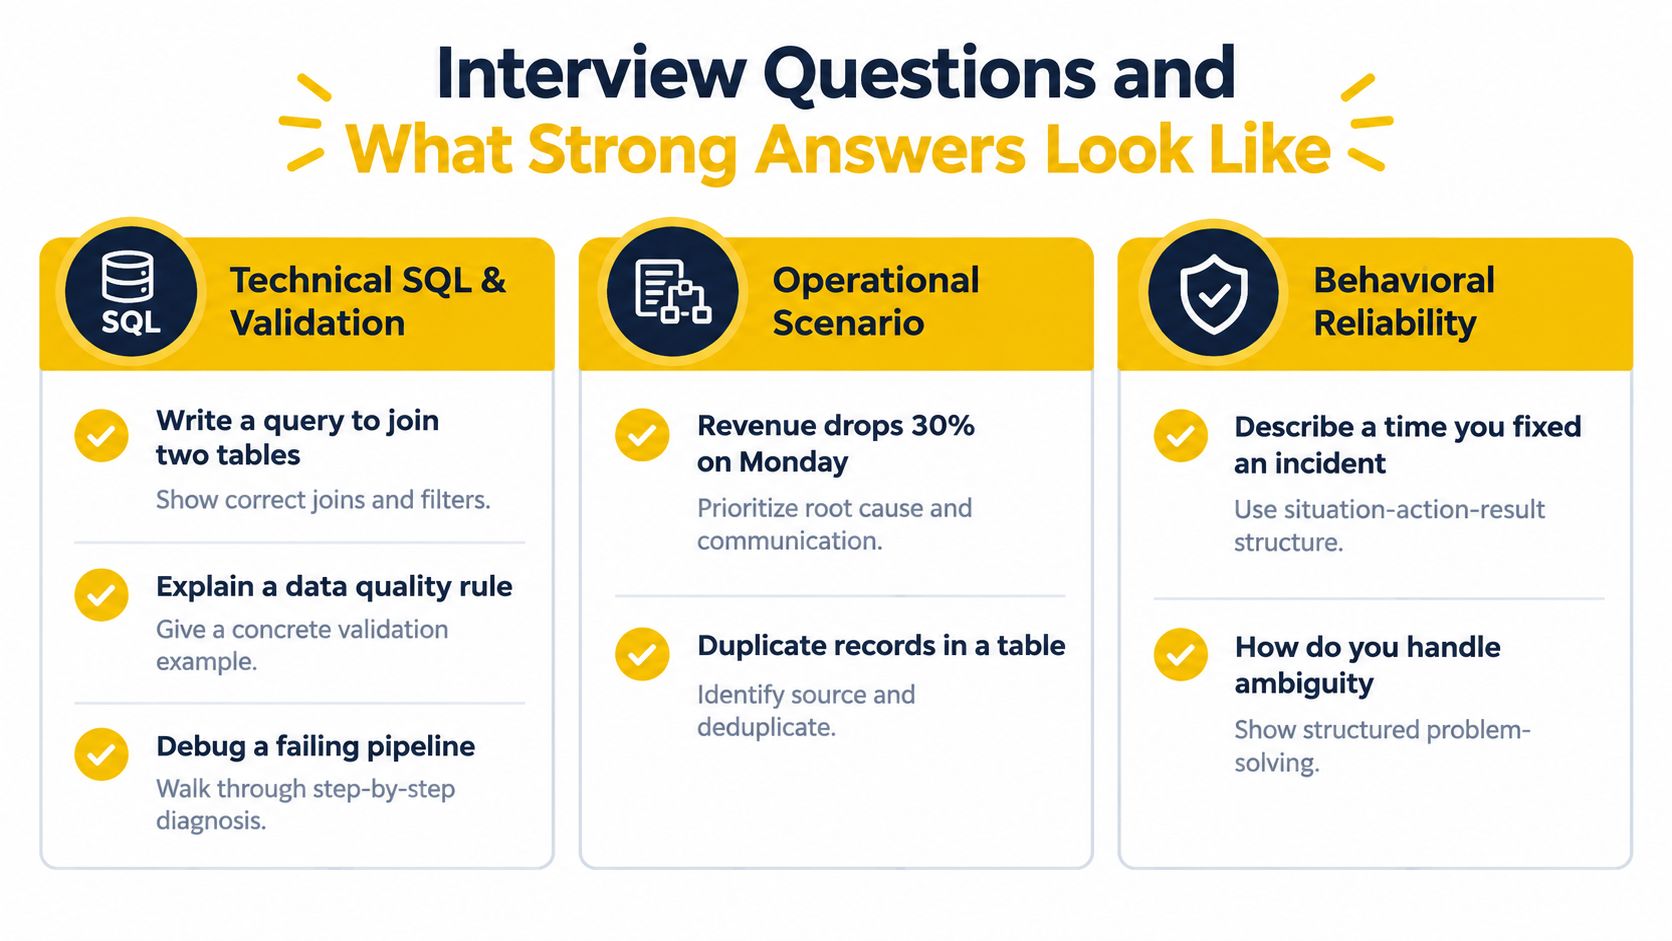
Data ops interviews test whether you can connect technical checks to operational consequences. A strong answer doesn't stop at naming a query or saying you'd investigate. It explains what you'd verify, how you'd know the check worked, and who needs the result.
Technical SQL and validation
A query question might ask you to join orders to customers and summarize revenue. Don't rush straight to the syntax. State the intended grain, identify the join key, consider whether each order matches one customer, and describe how you'd check that the join hasn't inflated the total.
If asked how you'd validate a dataset, give a concrete rule: for example, test that the order key is unique, required fields aren't null, and warehouse totals reconcile with the source. Explain what happens if a test fails. A rule without an owner or response is only a check, not an operating practice.
Operational scenarios
The question you'll want to rehearse is direct: “A dashboard drops 30%. How do you find out why?” A weak answer jumps to one cause. A stronger one checks source freshness and totals, transformation logic, permissions and filters, and whether the business changed. Then it sets an escalation threshold, identifies affected stakeholders, and explains what should happen if the report can't be trusted.
For a failing pipeline, walk through the evidence in order. Identify the last successful run, inspect the error and upstream inputs, test the suspected transformation, and verify the corrected output before calling the incident resolved.
Behavioral reliability
When an interviewer asks about a past incident, explain the situation, your actions, and the outcome without claiming sole credit for team work. Include how you handled uncertainty, communicated the risk, and prevented recurrence. “I fixed the report” is less convincing than an account of the validation rule, the handoff, and what changed afterward.
You can rehearse related SQL, dashboard, metrics, and stakeholder prompts with data analyst interview questions and answers. Interview Pilot also offers guided mock interview practice for working through questions aloud. This embedded video provides another way to revisit interview preparation:
AI, Automation, and the Reliability Premium
AI can produce a first draft of a query or summarize an error log. That doesn't make the data ops analyst less useful. It shifts more of the work toward checking whether an automated result is safe, correct, and appropriate to use.
A 2025 survey of data leaders identified data quality as a top priority for 41% of respondents (coverage of AI and data analyst roles). For candidates, the practical point isn't to claim that AI will replace or transform every job. It's that teams still need people who can catch wrong outputs before those outputs shape a decision.
Build evidence that you can verify automation
Create a small portfolio exercise that makes your judgment visible. Ask an AI tool to generate a SQL query, then write or review the equivalent query yourself. Test how both handle duplicate keys, null values, date boundaries, and unexpected categories. Compare their outputs with a trusted source report and record where the results disagree.
Document the lineage from input table to final metric, including assumptions the generated query made. If the tool invents a field, changes the grain, or produces a number that can't be reconciled, reject the output and explain why. That's stronger evidence than listing AI tools on a résumé.
Interviewers may ask how you'd handle hallucinated metrics, unauthorized data exposure, silent pipeline changes, or biased classifications. Treat these as operational risks, not abstract debates: identify what could be harmed, what evidence you'd check, who must approve a response, and how you'd document the decision. A candidate who can explain when not to automate shows the judgment that routine query production alone can't demonstrate.
Career Path and a 90-Day Plan to Get There
A data ops analyst can grow toward senior operational ownership, analytics engineering, or data product work. The transition usually shows up in the work before it appears in the title: you take responsibility for a reliability expectation, expand from supporting one report to understanding a whole data domain, and move from responding to incidents toward designing prevention into the system.
Start with a practical learning plan
Learn: Strengthen SQL joins, aggregation, common table expressions, window functions, and data-quality checks. Practice explaining grain and assumptions in plain language.
Build: Create a small pipeline or repeatable reporting workflow. Include freshness monitoring, validation rules, a reconciliation step, and a clear record of what happens when a check fails.
Document: Write a short incident playbook for a dashboard discrepancy. Include how you'd trace lineage, involve an owner, communicate uncertainty, and verify a correction.
Rehearse: Practice explaining your choices aloud, especially the dashboard-drop and lineage-tracing scenarios. A mock interview helps turn a list of techniques into a clear response under pressure.
Use the next few weeks to learn and build, then revisit your examples and tighten the documentation. You don't need to pretend you've operated a large production platform if you haven't. Show that you can reason carefully, validate your work, and make risks visible. Those habits are the foundation for moving from incident response to reliability design.
Interview Pilot offers guided mock interviews and a question bank that can help you rehearse data operations scenarios, from SQL validation to incident communication. Practice explaining your reasoning before the next interview, then visit Interview Pilot to explore its preparation tools.
Topics
data ops analyst
data operations
analytics career
data analyst skills
data ops interview
Continue reading

Career
Send Resume Email Sample: Templates and Tips
Need a send resume email sample? Learn when to email versus using a portal, plus get subject lines, templates, and formatting tips to get noticed.
October 12, 2026
12 min read

Career
10 Job Search AI Tools Compared for 2026
Compare 10 job search AI tools for job discovery, application automation, networking and outreach, with honest limits and starting tips.
October 12, 2026
15 min read

Career
8 Synonyms for Qualifications for Resumes
Explore 8 synonyms for qualifications, with clear examples for resumes, cover letters, and job applications.
October 8, 2026
18 min read