












Interviews
Data Analyst Technical Interview Questions and Answers: 2026
Explore data analyst technical interview questions and answers covering SQL, statistics, Excel, and real-world strategies for 2026.
Interview Pilot Editorial Team
Updated October 6, 2026
22 min read

You're in a live technical screen. The interviewer asks why revenue fell, then gives you three tables and a vague definition of “active customer.” You have limited time to clarify the business question, choose the correct grain, write a query, check the result, and explain what the business should do next. Producing valid syntax isn't enough. Your answer has to be defensible.
The most useful data analyst technical interview questions and answers span SQL, statistics, data quality, data modeling, metrics, visualization, dashboards, exploratory analysis, and analytical bias. SQL remains a high-priority preparation area because it appears in 52.9% of analyzed data-analyst job postings, ahead of Python, Power BI, and Tableau in that dataset (365 Data Science's job-market analysis). Strong candidates clarify assumptions, explain trade-offs, test edge cases, and connect technical work to a decision.
Use the questions below as compact interview playbooks. Structured mock practice and rehearsal tools such as Interview Pilot's technical screening resource can help you practise saying the reasoning aloud, not just memorising solutions.
1. SQL Window Functions for Cohort Analysis
A common prompt is: “Group users by signup month and calculate their activity over time. How would you identify each user's first event and compare behaviour within a cohort?”
Start by defining the cohort. If the business uses monthly signup cohorts, truncate each signup date to the month. Then calculate each user's first event with ROW_NUMBER() or MIN(), and use a window function to compare users or periods without collapsing the underlying rows.
For example, a PostgreSQL-style pattern could be written as WITH first_events AS (SELECT user_id, event_date, ROW_NUMBER() OVER (PARTITION BY user_id ORDER BY event_date) AS event_number FROM events), cohorts AS (SELECT u.user_id, DATE_TRUNC('month', u.signup_date) AS cohort_month, f.event_date FROM users u JOIN first_events f ON u.user_id = f.user_id WHERE f.event_number = 1) SELECT cohort_month, DATE_TRUNC('month', event_date) AS activity_month, COUNT(DISTINCT user_id) AS active_users FROM cohorts GROUP BY cohort_month, DATE_TRUNC('month', event_date);
The assumptions that make the query credible
Explain whether “active” means any event, a completed transaction, or a meaningful product action. State whether users with no events should remain in the denominator, and confirm that signup dates and event dates use the same timezone.
Use RANK() when tied values should share a position, DENSE_RANK() when tied positions shouldn't create gaps, and ROW_NUMBER() when you need one deterministic row. Add a stable secondary sort if ties could make the selected row change between runs.

Practical rule: A cohort query is only useful when the denominator, time window, and definition of activity are explicit.
A weak answer jumps straight to PARTITION BY and ignores duplicate events, null dates, or users who never return. A convincing answer says how the result could guide onboarding, retention work, or tracking trial conversions, then explains how you'd validate the counts against a trusted user table.
For a visual explanation of window-function thinking, this short walkthrough can reinforce the pattern.
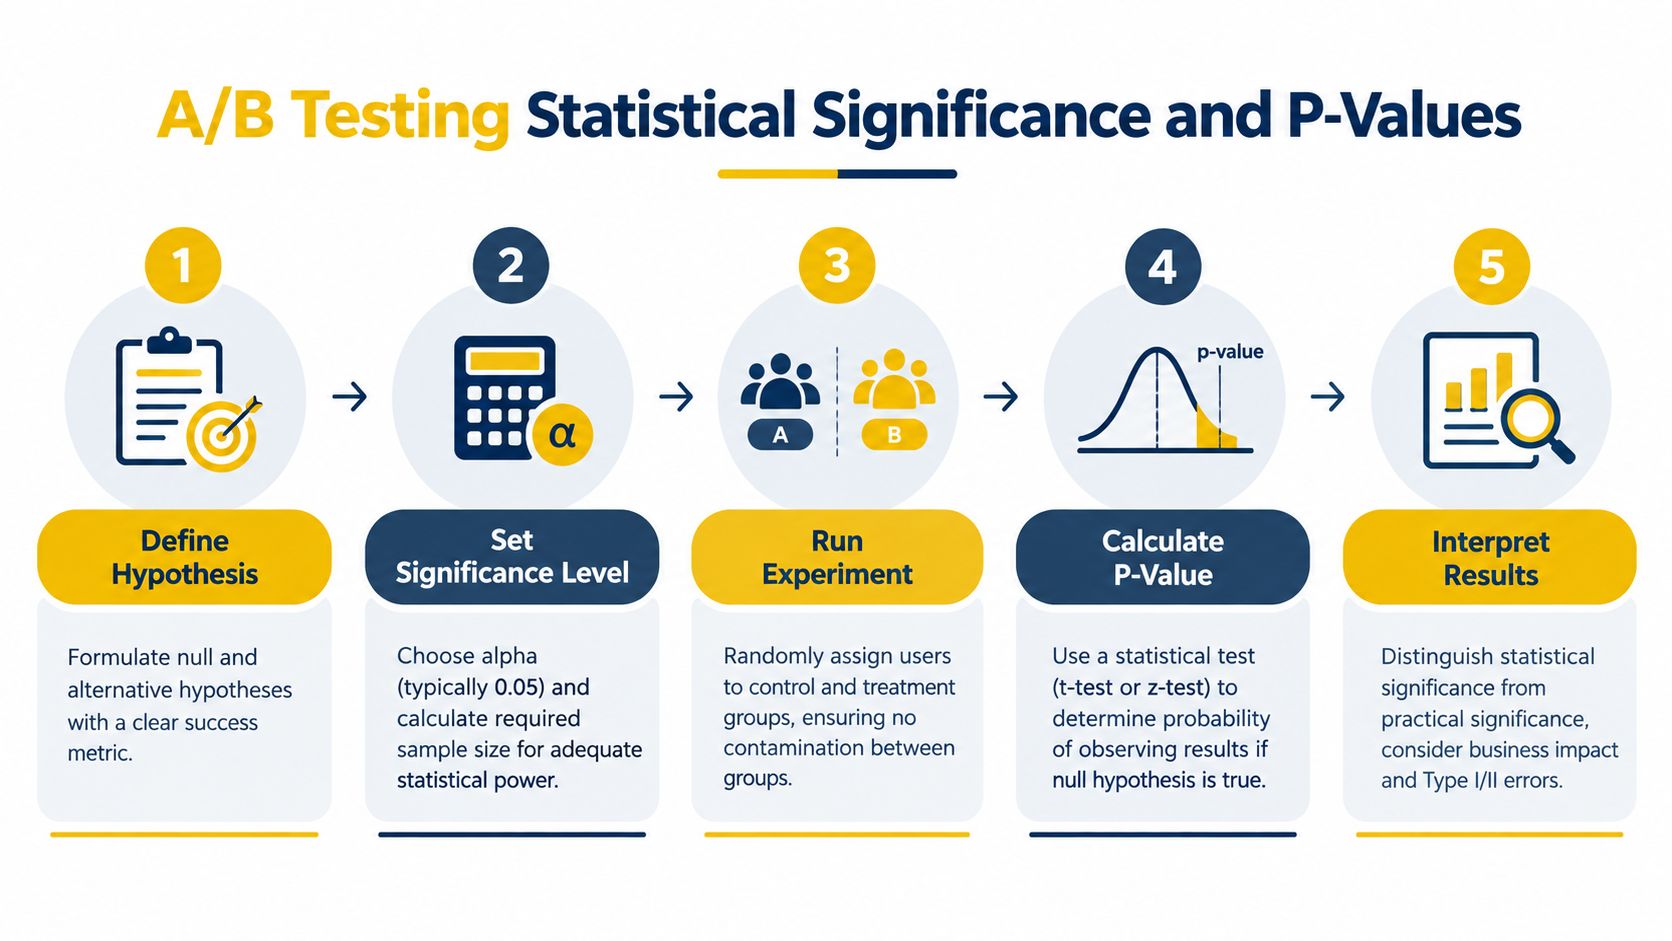
2. A/B Testing Statistical Significance and P-Values
A checkout experiment shows a higher conversion rate for treatment. The interview question is whether that difference supports a product decision, not whether the p-value “proves” the new flow works. A p-value measures how compatible the observed result is with the null hypothesis, usually that treatment and control have no difference under the selected test design.
Start with the decision and measurement plan. Define the primary metric, treatment and control populations, randomisation unit, planned sample size, significance threshold, and stopping rule. For a conversion metric, state the calculation clearly: conversion_rate = conversions / eligible_users. Confirm that each user is assigned consistently and that the denominator excludes users who were never exposed.
Separate statistical significance from practical significance. A statistically persuasive lift may be too small to justify engineering effort, operational work, or checkout friction. Report the effect size and confidence interval, then explain what result would change the business decision.
A response that shows statistical judgment
Type I error means acting on an apparent improvement that is not real. Type II error means missing a genuine improvement. Decide which mistake costs more before launch, because that choice affects power, sample size, and the decision threshold.
Do not repeatedly inspect results and stop when treatment leads. That practice changes the error rate unless the experiment uses a suitable sequential design. Check seasonality, repeat users, bots, and unequal exposure before trusting the result.
For technical interview practice with Interview Pilot, rehearse explaining the method in business language. In closing, connect the evidence to an action: ship, continue testing, investigate the mechanism, or retain control. Teams can avoid A/B testing mistakes by preregistering the stopping rule and decision criteria.
3. Data Cleaning and Handling Missing Values
“Thirty records have missing customer attributes. What would you do?” The best answer isn't “drop the rows” or “fill the blanks with the mean.” First identify what is missing, where it occurs, and why it may be absent.
Compare missingness across dates, regions, customer types, acquisition channels, and source systems. A blank optional field may mean a customer chose not to provide information. A sudden concentration after a system migration may indicate a pipeline failure. Those situations require different treatments, even when the visible symptom is the same.
A defensible cleaning workflow
Use a missingness indicator before transforming the data. In SQL, SELECT customer_segment, COUNT(*) AS total_rows, SUM(CASE WHEN phone_number IS NULL THEN 1 ELSE 0 END) AS missing_phone FROM customers GROUP BY customer_segment; can reveal whether missing values cluster by segment. In pandas, preserve the original column and create a flag such as phone_missing = phone_number.isna() before imputation.
- Delete selectively: Remove records only when the field is essential, the exclusion is defensible, and you've checked how the decision changes the population.
- Impute transparently: Use a business-appropriate value or group-level estimate when the assumption is reasonable, and label imputed records.
- Run sensitivity checks: Compare conclusions under deletion, imputation, and an explicit “unknown” category.
- Document limitations: Tell stakeholders what the data cannot support, especially when missingness may depend on the unobserved value.
A weak answer treats null as zero. A strong answer explains whether zero is a real observation, an unknown value, or an unavailable measurement, then connects the cleaning choice to the decision. You can also rehearse spreadsheet-based cleaning and validation with Interview Pilot's Excel interview questions.
4. Database Normalization and Dimensional Modeling
A useful interview prompt is: “How would you model orders, customers, products, and dates for reporting?” Begin by separating operational design from analytical consumption. Normalization reduces repeated data and update anomalies. A dimensional model makes recurring analysis easier to query and explain.
In a normalized operational structure, customer details belong in a customer entity, product details in a product entity, and order lines reference those entities. The progression from first normal form to third normal form removes repeating groups, partial dependencies, and transitive dependencies. The result is usually safer for transactional updates, but analysts may need more joins to answer a reporting question.
Choosing the model for the workload
A warehouse design might use an order-line fact table with foreign keys to customer, product, date, and channel dimensions. Define the grain in one sentence, such as “one row per product on an order.” That sentence prevents accidental double counting when someone joins a fact table to another table at a different grain.
Denormalisation can improve reporting simplicity or query performance, but it duplicates attributes and creates governance risks. Explain slowly changing dimensions when historical context matters. A Type 1 update overwrites an attribute, while a Type 2 design preserves historical versions with effective dates.
The common mistake is to describe a star schema without explaining what the business needs to measure. A convincing answer names a metric, identifies its grain, and explains how you'd prevent a customer join from multiplying revenue. Draw a small entity-relationship diagram mentally, then state how analysts will consume the governed model.
5. Calculating Customer Lifetime Value and Retention Metrics
“Calculate customer lifetime value and compare retention across acquisition channels.” Before writing a formula, ask what counts as revenue, whether refunds are removed, whether margin is included, and how the business defines an active or retained customer.
For a subscription product, you might calculate historical value by summing recognised revenue per customer and segmenting the result by acquisition cohort. A forward-looking estimate could combine average revenue, gross margin, expected retention, and a discount rate. The precise formula matters less than showing that each input has a definition and a limitation.
Make retention measurable
Retention can mean the share of a starting cohort that returns in a later period, the share still subscribed, or revenue retained from the same customer base. Those are not interchangeable. State the population, start date, observation period, qualifying action, and denominator.
A cohort query could first create one row per customer and activity month, then join each customer's cohort month to later activity. Use COUNT(DISTINCT user_id) for the numerator and the original cohort size for the denominator. Check whether a customer can produce multiple events in a period, because counting events instead of customers can make retention look stronger.
Business interpretation matters more than a polished formula. If one channel has higher initial retention but lower margin, the acquisition decision requires both measures.
Common mistakes include treating one purchase as a lifetime pattern, mixing gross and net revenue, and comparing cohorts with different maturity. A good answer ends with an action, such as reallocating acquisition effort, improving onboarding for a weak cohort, or investigating why repeat purchases decline. For further context, explain how the business might use customer lifetime value for UK e-commerce, without presenting an illustrative formula as a universal truth.
6. Creating Effective Data Visualizations and Choosing Chart Types
An interviewer may show you a dashboard and ask whether it communicates the message. Start with the audience and decision, not the chart library. A finance leader comparing categories may need bars. A product manager tracking movement over time may need a line chart. An analyst investigating relationships may use a scatter plot, provided the audience understands what each point represents.
Charts should preserve the data's meaning. Use a zero baseline when the scale makes that comparison important, label units, show the relevant period, and avoid decorative elements that compete with the finding. Colour should encode a deliberate distinction, such as highlighting one segment against a neutral comparison group.
Explain what you would reject
Pie charts can make close comparisons difficult. Dual axes can suggest a relationship between unrelated series or exaggerate one series' movement. A dense chart with every category may be technically complete but practically unreadable.

A strong interview answer might say: “I'd use a horizontal bar chart to compare churn by customer segment, sort it by rate, label the denominator, and add the previous period as context. If the audience needs to monitor change daily, I'd use a trend view instead.” That response shows visual judgement rather than memorised chart names.
Also mention accessibility. Check contrast, don't rely on colour alone, and test the chart at its final display size. The business takeaway should be visible in the title or annotation, while the analyst remains ready to explain definitions and caveats.
7. Writing Subqueries, CTEs, and Optimizing Query Performance
“Your query returns the right result but runs slowly. What do you do?” Start with diagnosis instead of randomly rewriting SQL. Confirm the expected grain, inspect the execution plan, check join conditions, measure row counts after each transformation, and look for accidental many-to-many joins.
A CTE often makes multi-step logic easier to inspect. For example, WITH monthly_sales AS (SELECT DATE_TRUNC('month', order_date) AS month, SUM(amount) AS revenue FROM orders WHERE order_status = 'completed' GROUP BY 1), ranked_months AS (SELECT month, revenue, RANK() OVER (ORDER BY revenue DESC) AS revenue_rank FROM monthly_sales) SELECT * FROM ranked_months WHERE revenue_rank <= 3; separates filtering, aggregation, and ranking.
Performance and readability are related, but not identical
Use subqueries for small, one-off logic when the structure stays readable. Use CTEs for named stages, repeated reasoning, or a query that another analyst must maintain. Temporary tables can help when a large intermediate result is reused or needs its own validation, but they add lifecycle and storage considerations.
Filter early when it reduces the data entering joins or aggregations, select only required columns, and avoid assuming that a CTE automatically improves performance. The database optimizer may inline or materialise it depending on the engine. Use EXPLAIN or EXPLAIN ANALYZE where available, and compare execution behaviour on data volumes that resemble production.
A credible answer also checks indexes or partitioning where relevant, but doesn't promise that adding an index will solve every problem. Practise variations of these patterns with data analyst interview questions from Interview Pilot, then explain why your chosen version is appropriate for the database and workload.
8. Exploratory Data Analysis and Statistical Distributions
“Walk me through how you'd approach a new dataset.” Start with the question and unit of observation. Before calculating correlations, inspect column names, data types, row counts, duplicate identifiers, missingness, date coverage, and plausible value ranges.
Then move from univariate to bivariate analysis. Review distributions with histograms or box plots, compare mean and median, inspect quantiles, and segment important measures by customer type, cohort, geography, or product. A revenue distribution may be heavily right-skewed, so the median and percentile view could describe a typical customer better than the mean.
Treat outliers as questions
An extreme transaction might be a data-entry error, a fraud event, a major enterprise purchase, or a legitimate but rare behaviour. Don't remove it because it is inconvenient. Flag it, trace it to the source, and run the analysis with and without it when the conclusion could change.
For relationships, use scatter plots, grouped summaries, and correlation carefully. Correlation can identify a useful hypothesis, but it doesn't establish causation. Statistical tests should follow the data-generating process and their assumptions, not replace visual inspection.
A weak EDA answer lists tools. A strong answer says what each check could reveal and how the finding would alter the next step. If a product's engagement distribution differs sharply by cohort, for example, you might investigate onboarding changes before recommending a broad product intervention.
9. Building Dashboards for Different Audiences and Metrics Selection
A dashboard request often sounds simple: “Show leadership how the business is performing.” Start by asking which decisions the dashboard should support, who will use it, how often they'll act, and which definitions already exist.
An executive view may emphasise a small set of strategic outcomes and trends. An operations view may require detailed queues, exceptions, and recent activity. A marketing dashboard may need channel, campaign, funnel, and cohort cuts. Reusing the same layout for every audience usually produces either clutter for leaders or insufficient detail for operators.
Define the metric before designing the tile
For every KPI, specify the numerator, denominator, time zone, inclusion rules, refresh schedule, and owner. A conversion rate can change because of genuine behaviour, a tracking issue, a filter, or a denominator definition. Put the definition near the dashboard or in linked documentation.
Include context such as a prior period, target, or meaningful segment. Add drill-downs only when they support a real investigation. Alerts should identify an actionable condition, not merely turn every fluctuation into an emergency.
The most common mistake is choosing metrics because they're easy to query. A useful dashboard moves from objective to metric to action. Test it with actual users, observe where they hesitate, and remove elements that don't help them decide. In an interview, describe how you'd validate both the data and the user experience before release.
10. Identifying and Mitigating Bias in Data Analysis
“Your analysis shows that paying customers are more engaged. Can you conclude that the product works better for them?” Not without examining the selection process. Paying customers may already have stronger intent, more resources, or longer exposure. Their behaviour may not represent prospects or churned users.
Discuss selection bias, survivorship bias, measurement error, confirmation bias, and confounding. Ask who collected the data, who is absent, which behaviours are measured reliably, and whether the metric changed over time. Historical hiring data, for example, may encode past decisions and reproduce their limitations rather than represent fair potential.
Show how you would reduce the risk
Use randomisation when the question is causal and an experiment is feasible. For observational work, segment results, compare alternative definitions, control for plausible confounders where appropriate, and make the limits of inference explicit. Seek evidence that could disprove your preferred explanation instead of selecting only supportive cuts.
Check measurement consistency across groups. If one demographic has more missing data or lower tracking coverage, a comparison may reflect instrumentation rather than behaviour. For predictive systems, evaluate performance and error patterns across relevant groups, then document decisions and unresolved risks.
A polished answer doesn't claim that bias can always be eliminated. It explains how bias could affect the decision, what checks are possible, and whether the remaining uncertainty is acceptable. That combination of technical caution and practical judgement is more valuable than naming every bias type without proposing a response.
Comparison of 10 Data Analyst Technical Interview Topics
| Topic | 🔄 Implementation Complexity | ⚡ Resource & Efficiency | ⭐📊 Expected Outcomes / Impact | Ideal Use Cases | 💡 Key Tips / Insights |
|---|---|---|---|---|---|
| SQL Window Functions for Cohort Analysis | Medium–High, requires understanding PARTITION/ORDER semantics and edge cases | Moderate compute; efficient on analytic DBs when indexed | ⭐⭐⭐, precise cohort retention and progression metrics (high analytical value) | Retention analysis, CLV by acquisition cohort, feature adoption over time | Use CTEs, test ties/NULLs, verbalize partitioning and ordering choices |
| A/B Testing Statistical Significance and P-Values | Medium, must design experiments and interpret inferential stats correctly | Low–Moderate, needs experiment platform and adequate sample size/time | ⭐⭐–⭐⭐⭐, reduces false positives; informs data-driven decisions (depends on power) | Conversion optimization, UI/UX experiments, marketing campaign tests | Pre-specify alpha/sample size, explain p-value vs. practical significance, avoid peeking |
| Data Cleaning and Handling Missing Values | Medium–High, often time-consuming and requires judgment | High time/resource cost (data profiling, imputation tools); can be slow | ⭐⭐⭐, foundational for valid downstream analysis; prevents biased results | Any real-world dataset ingestion, ETL, CRM/transaction cleanup | Diagnose MCAR/MAR/MNAR, document assumptions, run sensitivity analyses |
| Database Normalization and Dimensional Modeling | Medium, conceptual design trade-offs between normalization and denormalization | Moderate, design effort; tooling for ERDs and DWs; impacts query performance | ⭐⭐⭐, improves data integrity and long-term query efficiency when applied correctly | Data warehouse design, enterprise analytics, ETL schema planning | Draw ERDs, explain 1NF–3NF vs star schema, discuss SCDs and denormalization trade-offs |
| Calculating Customer Lifetime Value (CLV) and Retention Metrics | Medium, combines business assumptions with analytical methods | Moderate, requires historical data, cohort computations, simple modeling | ⭐⭐⭐, high commercial impact for acquisition/retention strategy | Subscription/SaaS budgeting, marketing ROI, cohort revenue analysis | Define retention clearly, state CLV assumptions, segment by channel, visualize retention curves |
| Creating Effective Data Visualizations and Choosing Chart Types | Low–Medium, needs design judgment and accessibility awareness | Low–Moderate, many tools available; fast to produce if data prepared | ⭐⭐–⭐⭐⭐, increases insight adoption and reduces misinterpretation | Executive reports, stakeholder presentations, exploratory storytelling | Match chart to relationship, follow Tufte principles, ensure accessibility and context |
| Writing Subqueries, CTEs, and Optimizing Query Performance | High, deep SQL and execution-plan knowledge required | Moderate–High, needs profiling tools and production-sized test data; optimization can yield big speedups | ⭐⭐⭐, improves runtime, scalability, and maintainability of analytics queries | Large datasets, performance-sensitive ETL/analytics, complex transformations | Use EXPLAIN/ANALYZE, filter early, avoid SELECT *, measure before/after changes |
| Exploratory Data Analysis (EDA) Process and Statistical Distributions | Medium, systematic but iterative; requires statistical judgement | Moderate, uses common tools (pandas, visualization libs); time-intensive upfront | ⭐⭐⭐, uncovers data issues and hypothesis-driving insights (high value) | New datasets, feature engineering, hypothesis generation | Start univariate, check distributions/outliers, document findings and next steps |
| Building Dashboards for Different Audiences and Metrics Selection | Medium–High, combines KPI strategy, UX, and reliable data pipelines | High, requires dashboard platform, data pipelines, and ongoing maintenance | ⭐⭐⭐, enables faster decisions and self-service analytics when well-designed | Executive KPIs, ops monitoring, marketing campaign dashboards | Start with business objectives, limit KPIs, document definitions, test with users |
| Identifying and Mitigating Bias in Data Analysis | High, requires domain knowledge, ethical reasoning, and statistical tests | High, may need diverse data, fairness tooling, stakeholder alignment | ⭐⭐⭐, prevents flawed or harmful decisions and legal/reputational risk | Models or analyses affecting people (hiring, lending, health), policy decisions | Question data source/coverage, test disparate impact, favor randomization and transparent limitations |
Turn Correct Answers Into Interview-Ready Proof
Knowing the definition of a window function or p-value doesn't guarantee a strong interview performance. Interviewers want to see whether you can move from an unclear request to a reliable recommendation. Your preparation should therefore rehearse the full chain, clarification, approach, implementation, validation, and communication.
Start with the prompt and ask what decision the analysis will support. Define the population, metric, grain, timeframe, exclusions, and success condition. If the interviewer says “customers,” ask whether that means accounts, users, or paying organisations. If they say “retention,” ask which event qualifies as retained and when the observation period begins.
Then solve the technical problem without notes. Write the SQL, statistical setup, or dashboard logic in a way another analyst could review. Name the assumptions before they become hidden inside a join, filter, imputation rule, or formula. If syntax varies by database, state the conceptual approach first and then adapt the syntax to the stated engine.
Validation should be visible in your answer. Check for duplicate keys, nulls, unexpected row multiplication, impossible dates, and denominator changes. Reconcile grouped totals to the source where possible. For an experiment, discuss randomisation, stopping rules, practical impact, and the consequences of false positives or false negatives. For a dashboard, validate both the metric definition and whether the audience can act on it.
Use a repeatable answer framework
Practise each question using this sequence:
- Clarify: Ask what the business needs to decide and define ambiguous terms.
- Approach: Describe the grain, population, metric, assumptions, and method.
- Implement: Write the query or analysis pattern and explain each meaningful step.
- Validate: Test edge cases, reconcile totals, inspect distributions, and challenge the result.
- Communicate: State the finding, limitation, and recommended action in business language.
After solving a prompt, change one condition. Add duplicate events, remove a date, introduce tied ranks, change a left join to an inner join, or make the denominator incomplete. These variations expose whether you understand the logic or have memorised a template.
SQL deserves sustained attention because the Harvard FAS career-services guide identifies SQL, Excel, dashboards, and statistics as recurring evaluation areas at major technology companies, while also highlighting joins, CTEs, window functions, readability, and performance optimisation (Harvard's data analyst interview preparation guide). Broaden that preparation with cross-tool translation. An O'Reilly survey of data professionals across 45 countries and 983 respondents found Excel and SQL each used by 69% of respondents, with R at 57% and Python at 54% (O'Reilly's survey results). The practical lesson isn't to master every tool equally. It's to explain when SQL is the right place to aggregate, when Python improves reproducibility, and how a governed dataset should feed a dashboard.
Finally, practise ambiguity rather than avoiding it. Business-facing interview questions may ask you to choose KPIs, estimate a market, validate an answer for nontechnical stakeholders, or work with unreliable data, as reflected in Indeed's data analyst interview question guidance. Rehearse saying, “I'd first clarify the decision,” then walk through the evidence and its limits.
Use a timer, speak your reasoning aloud, and record a few answers for review. Your goal isn't perfect syntax. It's a calm, transparent explanation that shows you can produce a correct result, recognise when it might be wrong, and help a team decide what to do next.
Interview Pilot offers guided mock interview practice, a searchable bank of data analyst questions, and real-time suggested answers for live online interviews. Use it to rehearse SQL, metrics, experimentation, dashboards, and stakeholder scenarios, then visit Interview Pilot to build a focused practice routine.
Topics
data analyst technical interview questions and answers
SQL interview questions
data analyst interview
technical interview preparation
data analytics
Continue reading

Interviews
10 Interview Questions Coding Patterns to Master
Master 10 interview questions coding patterns with sample solutions, complexity analysis, common mistakes, and practice strategies for technical interviews.
September 28, 2026
23 min read

Interviews
10 Technical Interview Questions Electrical Engineering
Master technical interview questions electrical engineering with model-answer guidance across circuits, power, control, semiconductors, and PCB design.
September 14, 2026
22 min read

Interviews
7 Technical Interview Questions for Freshers
Prepare for interviews with technical interview questions for freshers, answer guidance, examples, and focused practice strategies for entry-level roles.
October 6, 2026
3 min read